Tidetech provides a range of numerical weather model outputs sourced from official government sources and private weather providers. They include GFS – Global Forecast System (US National Centre for Environmental Prediction), ECMWF (European Centre for Medium Range Weather Forecasting) and CMC (Canadian Meteorological Centre). The primary operational product provided is the GFS, a model in common use by weather routing companies.
Validation statistics, comparing operational forecast weather models, are routinely provided by NOAA(https://www.emc.ncep.noaa.gov/users/verification/headlines/).
Statistical metrics averaged over the latest month’s data compare the performance of 6 operational models (including GFS, CMC and ECMWF) at the global and regional scale.
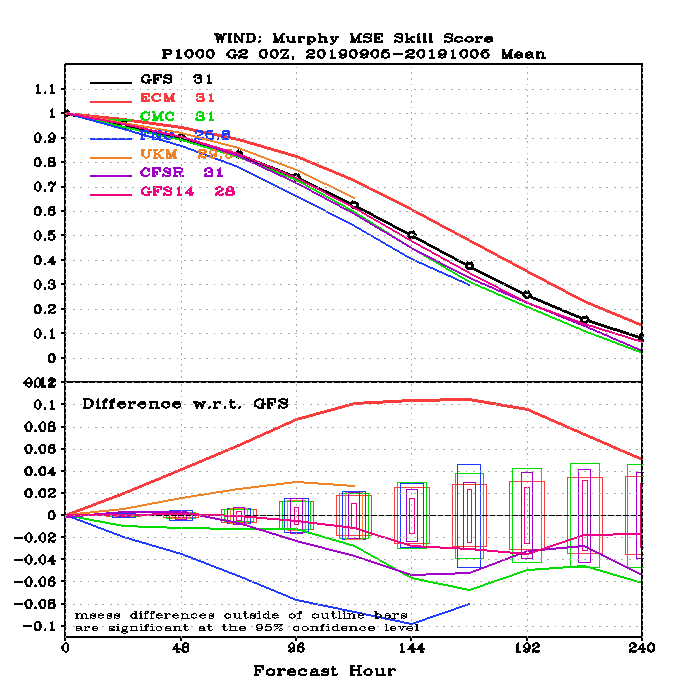
Murphy’s Skill Score is used as a comparative measure of forecasting skill for atmospheric models, where a value of 1 equals a perfect score. In Figure 1 the performance of the GFS model (black line) can be compared against other models.
Tidetech supplies wave data from the NCEP WW3 model (NCP).
The WMO (World Meteorological Organization) routinely conduct monthly summary statistics for wave parameters from all operational wave model forecasts (16 models, 5 day forecasts) against a common set of wave buoys (see https://www.jcomm.info/index.php?option=com_content&view=article&id=131&Itemid=37).
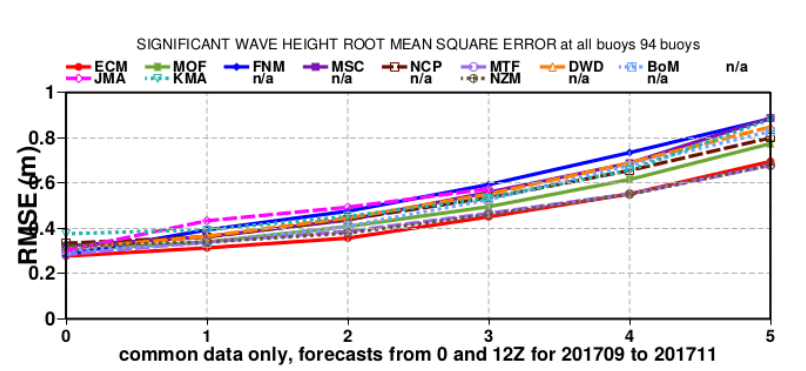
These buoys are concentrated in the areas of the northwest European shelf, the northeast USA, the northwest USA, the Caribbean and Hawaii with a handful of buoys elsewhere. These summaries (the latest of which is for September 2017 to November 2017) show that the RMSE of significant wave height (Hs) increases with forecast time (from 0.4m to 0.8m, with a consistent spread of 0.2m), as shown in Figure 2 taken from the report, in a similar manner to the wind speed forecasts above. Models tend to consistently either underestimate or overestimate Hs through the forecast window by approximtely 0.1m.
Tidetech obtains ocean model data from the Mercator (NEMO) model run by the Copernicus Environment Monitoring Service (CMEMS), and HYCOM run by the US Naval Research Laboratory.
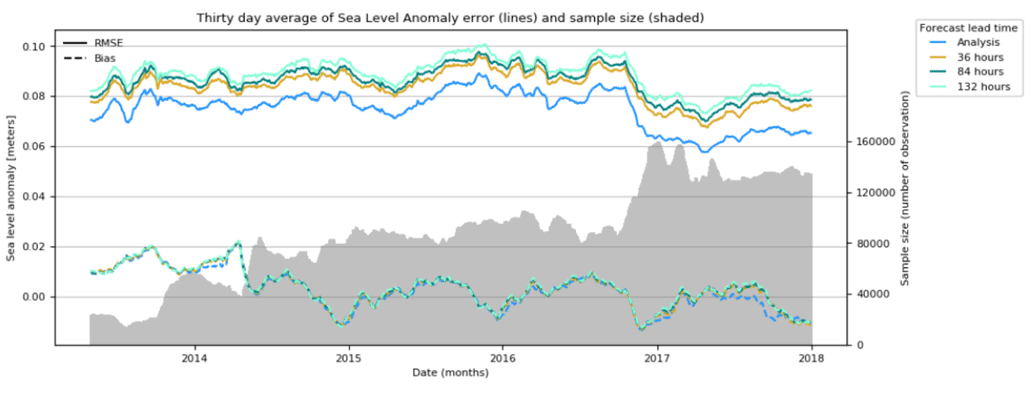
Validation for Mercator example: Metrics, comparing model against in-situ or satellite observations, are routinely calculated for several model parameters (salinity, temperature, sea level anomaly, sea surface temperature). Figure 3 shows the sea level anomaly (SLA) comparison for the entire globe between satellite altimeter and model over a 30-day averged period for the four year period April 2014 to December 2017. Sea level anomaly is chosen because this is the major contributor to determining the forecast accuracy of the large scale geostrophic currents.
It is seen that, on average, there is a consistent 7-8cm Root Mean Square Error (RMSE) for the analysis (time t0), which varies little over the first 3-years but then shows a significant reduction to 6cm at the start of 2017. Although worsening slightly, there is little difference between the forecast lead times of 36, 84 and 132h with the RMSE increased to ~9 cm. The bias, whilst almost always positive during 2014 (i.e. overestimating), shows an apparent annual oscillation with amplitude 1cm about zero in the following years with a negative maximum of -1cm in December.
The shaded area shows the number of altimeter measurements per averaging period, a function of the number of satellites available. With the additional satellites (e.g. Envisat) in 2017 the number of observations increases by 50% and, correspondingly, the RMSE shows a reduction with the increased number of satellite observations with forecast errors now similar to the analysis errors prior.
Tidetech constructs hydrodynamic models of tidal elevation and currents using techniques developed at the UK National Oceanography Centre (formerly the Proudman Oceanographic Laboratory).
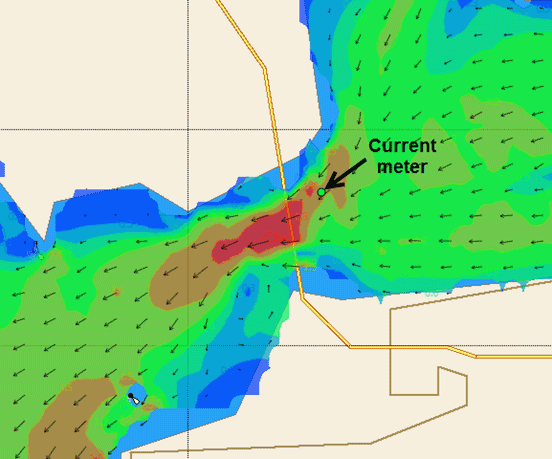
Model output is validated using available observations. The preferred method is validation against tidal currents obtained from current meters. Below is an example of validation of Tidetech’s high resolution model for San Francisco Bay.

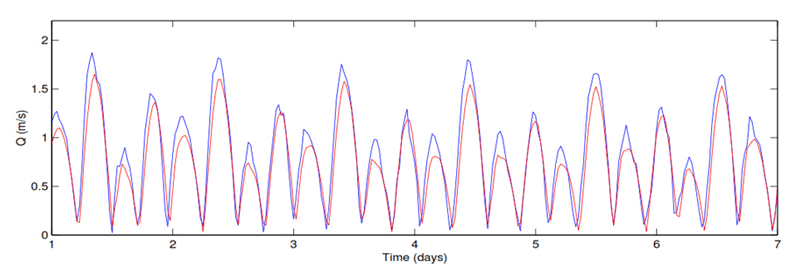
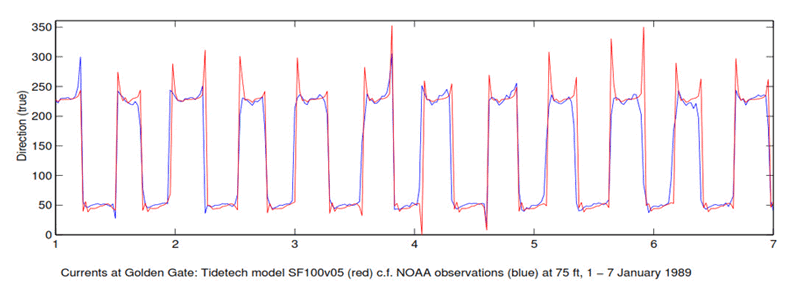
Unfortunately only a very small amount of current meter data is available worldwide due to the challenges of measuring currents in the open sea see more.
In lieu of current meter data, model output can be validated against tidal elevations obtained from analysis of tide gauge data. At least 12 months of observations is required to obtain sufficient tidal constituents to accurately predict future tidal elevations.
Locations where this quality of information is available is limited to major (primary or standard) ports. Ideally, to obtain the full set of tidal constituents the observations would need to span 18.6 years (the full tidal cycle).
Figure 5 shows validation of Tidetech’s high resolution model for San Francisco Bay against tide gauge data.
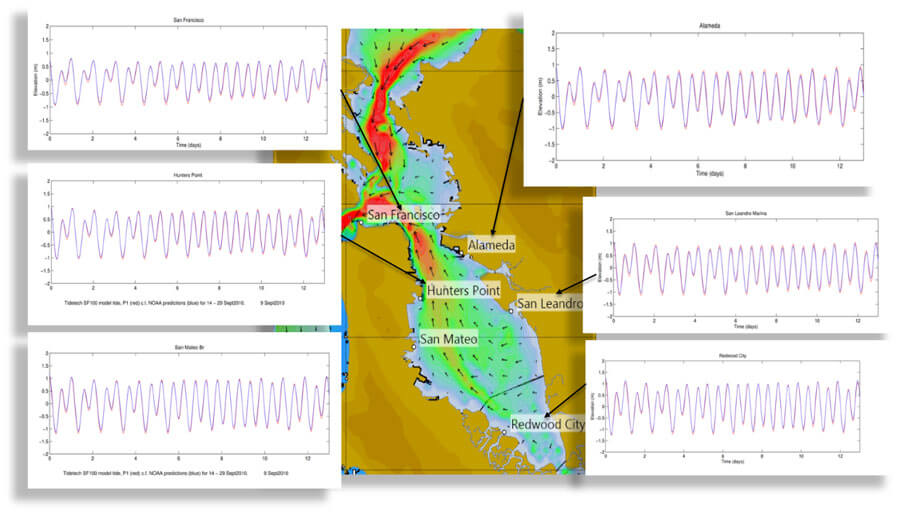
On a larger model grid, averaging of model values over a grid square will make comparisons more general in nature, but they are useful nonetheless.
Figure 6 shows comparisons between Tidetech 2km resolution English Chanel Model and Tidal elevation predictions produced from analysis of tide gauge data.
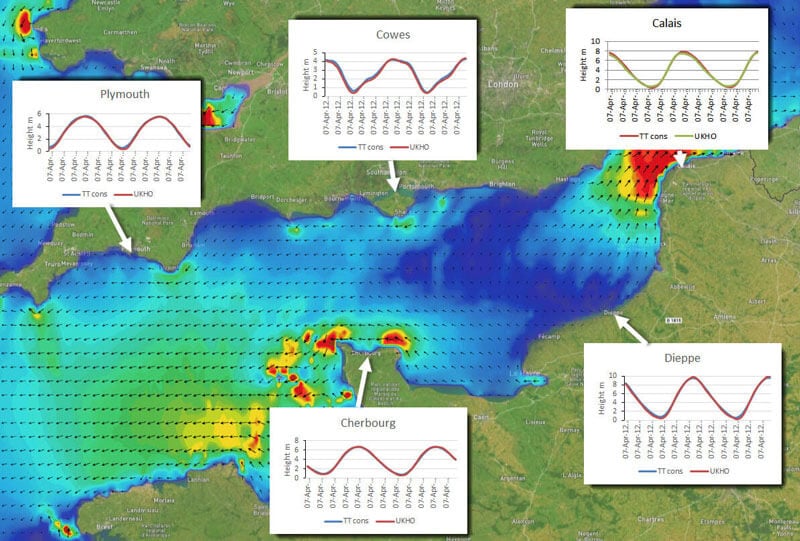
Tidal currents can also be validated against from official sources, although this approach should be used with caution. Unfortunately, unlike predictions of tidal elevations at major ports, predicted tidal currents from official sources can vary considerably in accuracy. Many are from observations taken a long time ago, before modern instrumentation. At least one month’s worth of observations is required to reproduce the primary constituents at a single location and in plenty of cases only a couple of day’s observations have been actually taken.
Observations taken when the meteorological conditions were not calm are also questionable, since wind driven surface currents can distort results.
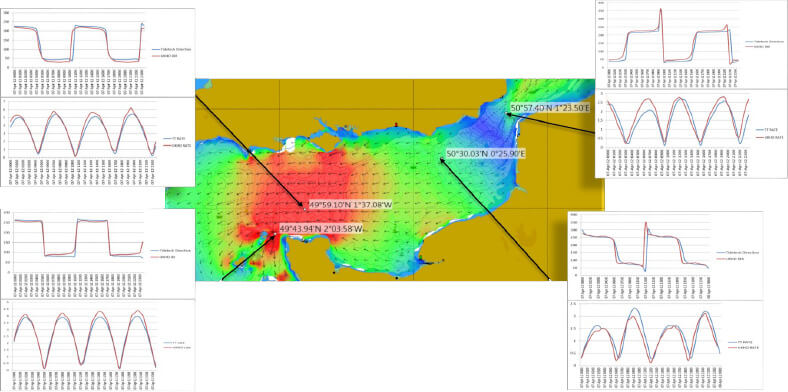
Figure 7 shows tidal currents from Tidetech’s 2km English Channel model validated against predictions obtained from UKHO tidal diamonds. Where there is a discrepancy, it is impossible to say whether the model is incorrect or the observations incomplete.

Sea surface temperature (SST). Tidetech uses a 1-km global blended product, produced daily. This product arises from a combination of different satellites and is produced by the Jet Propulsion Laboratory in California.
Comparison of the global product with in-situ data is carried out daily. Figure 8 below shows a scatter plot of blended SST against ship measurements for the 2nd May 2014, indicating the use of more than 3000 observations, with a mean bias of -0.12°C and a RMS of 0.79°C. This is a day taken at random and appears typical.